Tuesday, August 29, 2006

Big Drop in Perceived Job Availability

In the Conference Board’s monthly Confidence Survey, they ask respondents if jobs are “plentiful,” “not so plentiful,” or “hard to get.” I keep track of the percentages of respondents (as reported in the press release), particularly for the “plentiful” category. In August, it dropped by 4.2 percentage points, the biggest one-month drop since October 2001. In the past (since 1978, when the survey began to be conducted monthly), such large one-month drops have always been associated with recessions.

I wonder if this has anything to do with the declines in help wanted advertising that I observed here and here. (Do you think?) It is a bit of a puzzle, though, why perceived job availability held up so well until July.

Labels: , , , ,

Da mihi castitatem, sed noli modo

If you look through my July archives (the early part of the month, which is lower on the page), you can see discussions of various arguments for cutting the US federal deficit and why I don’t find those arguments convincing. I’ve come up with an argument now that I do find convincing. That is, I would have found it convincing a few months ago, but now I think it is outweighed by other considerations. Here’s the gist of it:

Under current law, Medicare is going to become prohibitively expensive in another 10 or 20 years. The government will have to find a solution, and the solution will almost certainly involve either means testing or taxes. Economically, means testing is equivalent to a tax. Therefore, high taxes in the future are a virtual certainty. Optimal taxation theory says that, the higher a tax is already, the more damage is done by increasing it, and the more advantage there is to reducing it. Since taxes in the future will be high, there is a great advantage to anything we can do to reduce those taxes. One thing we can do to reduce those high future taxes is to cut the deficit today so as to reduce the debt burden that will have to be paid out of those taxes.

In general, I can’t argue with this logic, but the thing is, there is a good chance the US will go into a recession some time in the next year, and it could get quite ugly. Based on recent experience, I wouldn’t rule out a liquidity trap. So I have rather reversed my earlier position. My earlier view was, “All my logic says the arguments against the deficit are unconvincing, yet I still favor deficit cuts, because it seems intuitively like the right thing to do.” Now I would say, “I have a solid logical argument against the deficit, but I nonetheless oppose cutting it. Save the fiscal responsibility until the danger of recession has passed.”

Some people would say (1) a recession is the Fed’s problem, and the Fed can compensate for fiscal tightening, and (2) as for a liquidity trap, we can cross that bridge when we come to it, so (3) we should cut the deficit now, which will give us more of a chance to increase it later when it may be really necessary. But that strikes me as just the kind of timing mistake that has given macroeconomic fine tuning a bad name. Except for the dumb luck of the 2001 tax cut, fiscal stimulus during the post-World-War II period has always been applied much too late and succeeded only in accelerating already strong recoveries. This time around, why not try to prevent a recession? Or at least don’t deliberately make it worse. The Fed may need to bring the US to the brink of recession to maintain its credibility, but Congress has no credibility to lose. Somebody has to be the good cop.

Labels: , , , , , ,

Monday, August 28, 2006

Depreciation and the Profit Margin Puzzle

Dean Baker provides (a small) part of the answer to my “profit margin puzzle” (although he doesn’t frame it in those terms). Gross profit margins (represented by the divergence between the GDP deflator and unit labor cost) partly had to rise to compensate for increased depreciation, to keep net profit margins from falling. In other words, if you know your capital will have to be replaced more often, you have to charge more for your products in order to make provision for that replacement. However, for the period I looked at (starting in 1991) depreciation as a fraction of GDP rose only from 12.1% to 12.9%. Since the GDP deflator diverges from unit labor cost by an average of more than 0.5% per year over 15 years, this roughly 0.8 percentage point difference just chips away at the puzzle (less than 2 years worth out of 15).

Labels: , , , , , , ,

Phillips Curve

In Arthur Laffer’s case, it might have been carelessness in the use of words, but the latest attack on the Phillips curve by Larry Kudlow (discussed by Mark Thoma and pgl) is unmistakably either disingenuous or ignorant. (I'd prefer not to use such inflammatory terms, but I just can't think of a nice way to say it.) I single out Larry Kudlow only because his is the most recent example. I’ve heard similar arguments in the past, and I’m never sure whether the people making the argument realize that they are attacking a straw man – a man made completely of straw, that is, with no hope of even finding the Yellow Brick Road. But it’s one or the other: either Larry Kudlow is trying to pull the wool over people’s eyes, or he is somehow unaware of the last 40 years of Phillips curve research.

His argument essentially goes like this: the Phillips curve is an inverse relationship between unemployment and inflation. What we observe, however, is that the relationship is positive, not inverse. Therefore the Phillips curve is wrong.

That might be a strong argument against the version of the Phillips curve that was widely believed during the 1960s (the “groovey” Phillips curve, as Gabriel Mihalache called it in an earlier comment). That version posited a stable relationship between the unemployment rate and the level of inflation, the same relationship in the long run as in the short run. The problem is, nobody believes in that version of the Phillips curve any more. Don’t even bother looking in the duffle bag. That argument was settled conclusively before Bill Gates dropped out of college.

For practical purposes, the Phillips curve – the version that is used to guide forecasts and generate policy prescriptions today – is not a relationship between unemployment and the level of inflation; it is a relationship between unemployment and the change in the inflation rate. (There are subtle reasons why this practical definition isn’t exactly right, but for such a simple formulation, it comes awfully close. Econometrically speaking, the Phillips curves fit by people like empirical Phillips curve guru Robert Gordon have exactly this “accelerationist” property.)

So let’s look at the data. Suppose we don’t even bother with all the econometric subtleties that people like Robert Gordon and Mark Thoma would urge upon us. Suppose we just do a straight scatterplot. Here it is:


I don’t know about you, but that sure looks like an inverse relationship to me. Want to include the 1970s? OK.

Labels: , , , ,

Saturday, August 26, 2006

Unproductive Landing

Expect some bad news about US productivity in the coming quarters – and remember to ignore it. It is well known (though often forgotten) that productivity follows a consistent pattern over the business cycle. During recoveries, it rises rapidly, as firms ramp up production before adding staff; during (and just prior to) recessions, it falls (or slows down), as firms hold on to more staff than they need (presumably in anticipation of an eventual recovery). It is less well-known – because it has only happened once – how productivity behaves during “soft landings.” In principle, however, a soft landing could be even worse, productivity-wise, than a recession.

A recession involves – more or less by definition – declining employment, which reduces the denominator of the productivity ratio and moderates the decline in productivity. A soft landing probably doesn’t involve declining employment. (If it did, I wouldn’t call it a soft landing. Would you?) The ideal soft landing presumably brings firms just to the brink of the point where they would reduce employment. To adjust to weaker demand without reducing employment, firms would have to reduce the numerator (output) of the productivity ratio without substantially reducing the denominator (although they would reduce it a little by using fewer hours from current employees). Thus a soft landing might well bring us to the worst part of the productivity cycle.

Just to substantiate this point empirically, yes, productivity did fall during the 1995 soft landing. During the first 2 quarters of 1995, it fell at annualized rate of 0.9%. For the full year (Q4 to Q4), it rose at the anemic rate of 0.7%. And productivity growth also slowed during the “soft quasi-landings” of 1967 and 1986.

So whether we have a recession or a soft landing, my psychic powers are sensing some unpleasant productivity numbers in our future. Of course, my psychic powers could be wrong, mostly because we may have neither a soft landing nor a recession. We could have a “non-recessionary hard landing,” during which employment falls but the cheerleaders continue yelling “GDP is growing! GDP is growing!” and the NBER refuses to declare a recession. To my knowledge, nothing like that has ever happened in the US, but similar things have happened elsewhere, such as in Japan. Alternatively, if the Iranian nuclear crisis gets solved, the Lebanon cease-fire holds up, Iraq avoids a civil war, and the hurricane season spares oil production, we could conceivably have a “perfect landing” in which declining energy prices allow normal growth to resume quickly without prompting the Fed to slow it down again. If that happens, then we’ve already had our soft landing. (Did you notice all the complaints about second quarter productivity growth?) Or…we could have a soft landing – or even a recession – that coincides with enough technological improvement to mask the productivity effect.

None of these 3 alternative scenarios seems likely, so I’d bet with my familiar spirit on this one. Although 2nd quarter productivity may be revised upward, don’t be disappointed when the subsequent quarters’ data come out. And by the way, measuring from the peak productivity of Q2 2000, the average productivity growth rate this time around has been 2.9%. That tops the previous (widely celebrated) productivity cycle (starting from the peak in Q4 1994) by a good 40 basis points. So if Q2 2006 turns out to be a peak, it’s been a damn good cycle!

Labels: , , ,

Friday, August 25, 2006

What is Inflation?

I’m not sure what combination of carelessness, ignorance, malice, and/or rhetorical convenience causes Arthur Laffer to mischaracterize the Phillips curve, but…maybe I should be nicer, since I actually agree with Laffer’s main point.

Laffer is countering a view recently expressed several times on the same Opinion page (including by the Journal’s editors). Essentially, the argument he is rebutting goes something like this: “Prices are rising. Thus by definition we have inflation. The Fed should keep tightening in order to get rid of this inflation, before it becomes embedded in the system. The Fed has stopped tightening only because it sees (or expects) a slowdown, and because it believes in the Phillips curve, which says that a slowdown will reduce inflation. But we all know that the Phillips curve is a bunch of crap.”

Laffer begins his response by saying, in my broad paraphrase, “Ah, yes, we all do know that the Phillips curve is a bunch of crap, but…” He gets to the point by the end of the second paragraph (now I’m quoting literally):
…to confuse an increase in commodity prices with general inflation is a serious mistake, one which often seduces otherwise clear-thinking economists.

(I guess by “clear-thinking economists” he means those top-of-the-duffle-bag folks who don’t believe in such nonsense as the Phillips curve – a category which, as Donald Luskin points out, excludes the current Fed chairman. But I think a few of my fellow bottom-of-the-bag Keynesians might be confused as well.) I don’t agree with everything Laffer says subsequently (for example, why are “further declines in the dollar…not very likely,” considering that, after all, the “U.S. global capital surplus” that occasioned the decline has only gotten bigger?), but I take his main point to be about the definition of inflation.

The word “inflation” is essentially a metaphor: pushing money into the economy to produce higher prices is like blowing air into a balloon; it doesn’t add to the substance, but it makes the balloon look bigger. As a Keynesian, I do believe there are a lot of subtleties in the process: for example, the money doesn’t have to be pushed by the Fed or even by the banking system; it could be an increase in “velocity” occasioned by changes in preferences or “animal spirits.” And the economy doesn’t work quite like a balloon, because pushing money can in some cases increase the substance (because of sticky prices and wages). Thus I don’t think that growth in the monetary base, which Laffer charts, is a sufficient indicator of whether or not the Fed’s policy is inflationary.

But let me return to the metaphor. If the prices of volatile commodities are rising, and the prices of finished goods and services are rising at a slower rate than would be warranted by their commodity content (which is to say, the price of value added above those component commodities is not rising, at least not any faster than is considered normal), how does this resemble a balloon blowing up? Most of the balloon is not expanding. And if you examine the role of money, the flattening of the monetary base at the top of Laffer’s chart has actually had the effect of raising prices, by putting upward pressure on rental costs. It’s a very odd balloon that expands when you let the air out! It seems that, if we interpret the word “inflation” in keeping with this metaphorical etymology, it surely does not describe what is happening today.

Labels: , , , , ,

Thursday, August 24, 2006

Dangerous Curve

Arthur Laffer, on the opinion page of today’s Wall Street Journal (hat tip to Dave Altig), writes:

You'd have to dig pretty far down in the duffle bag of economists to find one who actually believes in the Philips Curve-- the idea that rapid growth causes inflation.

It appears that, all these years that I’ve been studying the Phillips curve, I’ve been under a wrong impression about what the Phillips curve was. You see, naïve as I was, I thought that demand was the causal factor. I thought that excess demand caused both faster growth and rising inflation rates. I had this crazy idea that maybe, faced with excess demand, firms would both raise prices and increase production, thus increasing the inflation rate and increasing the growth of output at the same time. And I also thought that this excess demand would give firms a reason to hire more workers, even if they had to pay higher wages to do so, so the unemployment rate would fall and wages would rise. Seems like a pretty reasonable theory to me; I doubt you would have to dig very far down in the duffle bag to find an economist who believes it. But apparently, this is not what the Phillips curve is about.

No, according to Laffer, the Phillips curve is the idea that growth itself causes inflation. That is a really dumb theory. No wonder so few of us actually believe it. All this time I thought I believed in the Phillips curve, when actually what I believed was something quite different.

Labels: , , , ,

Sunday, August 20, 2006

God and the Investment Tax Credit

OK, this really doesn’t have much to do with God. The title is taken from that of a sermon by a (fictional) televangelist on an old sitcom. (I think it was Hail to the Chief, but I’m not sure, and I may have gotten the quote wrong, too.) I do think, however, that every good Christian (as well as every good Jew, every good Muslim, and for that matter every good atheist) ought to consider the importance of investment incentives at this point in the business cycle.

In my last post, I rather pooh-poohed investment incentives (“…the tax cuts were not irresponsible enough”), and I am rather skeptical about incentivizing investment by reducing taxes on the returns to investment. For one thing, I’m skeptical about the effectiveness: even with the tax cuts, the hoped-for investment boom has not materialized during this business cycle. (Contrast the last business cycle, which began with a tax increase.) Second (which is really the same thing), I don’t think these types of incentives are cost-effective with respect to lost revenue: to create a strong incentive you need to reduce taxes permanently, since the assets involved are long-lived; after a few decades, the revenue loss adds up. Finally, that very permanence means that it is impossible to put the genie back in the bottle if we encounter (like China today) a condition of overinvestment. Well, it’s impossible unless you break your promise by rescinding the tax cut. (I’ve never been a fan of policies that are known in advance to be dynamically inconsistent.)

So I favor, instead, direct investment incentives (hence the title of this post). Actually, rather than an investment tax credit, my preference would be for something like unlimited expensing, which is much more straightforward: when you buy something for your business, you can deduct the cost from your taxable income, period. But my point is that now is the time to do it. Instead of waiting for a recession before starting the legislative process, so that the tax cut goes into effect just in time for the recovery and the result scares the Fed into slowing down that recovery, pass the investment incentives now. (Hey, Republicans, do it while you still have a chance!)

The best case scenario, from the point of view of timing, is that we are poised to go into a recession at just about the time when the incentive would take effect. In that case, the incentive provides both a well-timed Keynesian stimulus to use up slack resources and an inducement to divert resources toward more prudent use. The worst case is that we are going into an economic boom, and the incentive exacerbates the boom. We should have such problems…but we won’t, I’m pretty sure. Realistically, the worst case is that we push this recovery just a little bit too far, and the Fed has to keep raising interest rates for longer than expected. Boo-hoo for the housing market, but if the excess demand goes into nonresidential investment and increases our long-term productive capacity, I won’t be crying too much.

In a worst-timing-case scenario, investment incentives could exacerbate the trade deficit by encouraging businesses to use up more of their savings, forcing households and government to borrow even more from abroad (if, as the worst case assumes, households refuse to start saving). In the longer run, however, investment incentives could help reduce the trade deficit, particularly if the timing turns out (as I expect) somewhat better. As Andrew Tilton of Goldman Sachs (channeled through The Economist and Brad Setser) notes, increasing exports will require increasing export production capacity. If we want to increase exports (and surely we do), why not make it easier for firms to increase capacity?

Labels: , , , , ,

Saturday, August 19, 2006

Taxes, Housing, Growth, and War

The following seem to be a standard set of tenets for anti-Bush crowd:

  • The Bush tax cuts were irresponsible.

  • The housing boom was unhealthy.

  • Employment growth over the past five years has been inadequate.

I’m no fan of W myself, but I’m puzzled by this triplethink. What macroeconomic policies were people hoping for? What policies would have increased employment without exacerbating either the budget deficit or the housing boom?

Let’s look at an alternative path in which the tax cuts hadn’t taken place. The tech bubble would have burst anyhow. (It started to burst long before the first tax cut.) Without the 2001 tax cut, the recession would have been deeper and lasted longer. Without the 2001 and 2003 tax cuts, the painfully slow recovery would have been even slower. Quite possibly the Fed would have cut rates all the way down to zero. (That’s only one percentage point away from what actually happened.) The housing boom – as the only major source of demand facilitating a recovery – would have been pushed to an extreme that would make last year’s experience look mild. (Exercise for the reader: calculate the present value of a perpetual stream of housing services discounted at 0%.)

If anything, the tax cuts were not irresponsible enough. Instead of tax cuts on capital income, designed to encourage virtuous activities like saving and investment, what we needed were sleazy, Keynesian tax cuts to encourage Joe Sixpack to switch to high-quality microbrews. (Fortunately, the tax cuts were entirely ineffective at encouraging saving.) Or perhaps, instead of tax cuts, we should have built a lot more bridges to nowhere back when we were facing an excess of unbroken windows.

The only alternative economic stimulus would have been a weaker dollar. You may recall, though, that Europe and Japan were facing inadequate growth at the same time, and the other Asian countries had plenty of unexploited potential. A deliberate weak dollar policy, back in 2001-2004, would have fallen into the classic “beggar thy neighbor” category. And with the rest of the world playing the same game, it’s implausible that ordinary fiscal, monetary, and “talking down” policies could have made the dollar so weak as to substitute for the stimulus of the tax cuts. That would have required dramatic intervention against the dollar, on a scale never even imagined, and with the explicitly aggressive intent of forcing the Asians (under threat of bankruptcy) to give up their own intervention policies. I don’t recall anyone advocating such actions at the time.

If you want to blame Bush for the economic problems of this decade, don’t blame his economic policies; blame his foreign policy. Whatever its ex ante merits may have been, the Iraq war, along with the atmosphere of tension it induces in the region, has clearly been partly responsible for the rising price of oil, which is exactly what has placed such a tight limit on the current recovery. (Try this thought experiment: assume the actual path for the cost of non-energy value added in the US, and suppose that the price of oil had risen much less. What would the inflation rate be? Would the Fed have kept tightening so long?)

Labels: , , , , , , , ,

Thursday, August 17, 2006

In Defense of Labor Cost Targeting

A week or two ago, I made the apparently heretical suggestion that the Fed should target unit labor costs. Brad DeLong picked it up with a link to my subsequent post. Several objections have been raised, and I want to deal with those objections here.

The main objection, coming from Dean Baker and kharris, is essentially – to use my own earlier words – that the unit labor cost series is “subject to revision, and volatile from quarter to quarter.” As I agued in the original post, “This would be a big problem for an intermediate indicator, but not so much for an ultimate target. The important thing is that the long-term trend be predictable…” Unit labor cost depends on compensation rates and productivity. I think the Fed is already pretty good at forecasting the trend in compensation rates. Productivity is more difficult, but this is a problem even if you target inflation.

Granted, the long-term trend in labor costs is probably not (contrary to what I suggested in the original post) as predictable as that of inflation. This is a disadvantage, but it is (I would argue) far outweighed by the advantages, particularly the relative robustness to the effects of supply shocks. Under a price-based (rather than labor cost-based) targeting regime, a huge adverse import price shock (such as a major dollar crash or sudden increase in oil prices) would virtually force the Fed to induce a recession. (Indeed, the Fed may have induced a recession – yet to fully materialize – in response to the more gradual oil price increases of the past few years.) Under a labor cost-based regime, the price shock could feed through to consumer prices without necessarily having a large effect on economic growth or employment. In principle, why should a scarcity in one commodity (such as oil) automatically induce a scarcity in another commodity (money)? Doesn’t a currency “backed by the productivity of the US labor force” inspire more confidence than a currency “backed by the promise of price stability”?

As my thinking has evolved, I would also suggest that a labor cost target should have the form of a “price rule” rather than a “growth rule.” That is, the Fed should explicitly try to correct deviations from trend rather than establishing a new trend when the old one is broken. The “price rule” approach helps with the data volatility problem by letting the Fed allow temporary deviations while credibly promising to maintain the longer-term trend.

Another objection, coming from an avowed non-expert:

When I hear "targeting unit labor costs" what I also hear is "we don't want workers to make more money, ever." To a lay observer like me, the Fed (and its counterparts in Europe) seem determined to prevent workers' wages from rising.

Actually, when I wrote the original post, I asked myself, “Would this regime discriminate against workers?” Would it automatically “take away the punch bowl before workers get to drink?” I think the answer is no. A labor cost target would allow workers to take full advantage of productivity gains, something they have apparently not been able to do under the current regime. Of course, firms could take back that advantage by raising prices, but I’m not sure that’s such a bad thing. In a sense, the current regime has allowed firms to undertake “stealth price increases” by keeping wages down. Under the current regime, the Fed is like, “Oh, hey, we’re just controlling inflation,” and firms are like, “Oh, hey, we’re just trying to keep costs down.” Under my proposed regime, firms would have to own up to the fact that they are grabbing a bigger share of the pie. If there are legitimate economic forces that are granting them that bigger share, then so be it, but let’s bring this process out into the open air of consumer markets rather than burying it in the back room of compensation determination.

Labels: , , , , , ,

Wednesday, August 16, 2006

Catch Me Now I’m Falling

(This is Captain America calling...)

Only export demand can save the US from a hard landing.

The recent recovery appears to have been primarily a result of the Fed’s easy money policy of 2002-2003, which appears to have been effective primarily by means of its effect on the housing market. The Fed began to remove accommodation at the end of the second quarter of 2004. The housing market peaked in the fourth quarter of 2005 and is now showing dramatic signs of weakness. The recovery began to wind down in the second quarter of 2006, as evidenced by the string of weak payroll employment statistics that began in April and stood in stark contrast to the first quarter’s numbers. This pattern suggests a long lag – about 21 months – between monetary policy actions and effects during the current cycle. If the timing is similar on the way down, then we should expect a trough in the first quarter of 2008 – and if the US economy continues to weaken between now and then, it will be a long way down.

The downturn in housing affects construction and consumer spending. If we’re very lucky, the price of oil will go down and offset some or all of the effect on consumer spending, but with the personal savings rate currently already negative, there is little reason to hope for consumers to continue leading a recovery even if oil prices do decline. Nor is there evidence of a domestic investment boom riding in on a white horse, despite the tremendous amount of cash that corporations now have available. Such a boom, if it materializes, will have to be motivated by some expectation of demand. That demand won’t come from consumers. It won’t come from government, which is in deficit-cutting mode and already winding down its role in rebuilding last year’s hurricane damage. If the demand comes, it will come from exports.

Labels: , ,

Monday, August 14, 2006

Back-of-the-Envelope Equity Premium

Historically, corporate equity has returned about 6% more annually on average compared to government bonds. If I expected the equity premium to be that high going forward, I would be fully invested. In fact, I would be maxing out my HELOC to buy stock. But a 6% equity premium seems like quite an unreasonable expectation at this point in time. What might be a more reasonable expectation?

I’ve tried two methods to come to an answer. The first method assumes that dividends will grow at the same rate as GDP, then estimates expected real GDP growth, adds the dividend yield, and compares the result to the 10-year TIPS yield. The second method assumes that corporate profits will return to their historical fraction of national income, adjusts current earnings accordingly, adds the expected inflation rate, and compares the result to the nominal 10-year Treasury yield.

Method 1. To estimate real GDP growth (for the US), I take the trend labor productivity growth rate of 2.7% (based on my exponential smoother optimized for an 8-quarter-ahead forecast) and add an assumed labor force growth rate of 1%, so the estimated real GDP growth rate is 3.7%. The dividend yield on the S&P 500 is 1.95% according to this week’s Barron’s, and the 10-year TIPS yield is 2.32%. The calculation 3.70% + 1.95% - 2.32% gives an estimated equity premium of 3.33%. It’s not nearly as “puzzling” as the historical 6%, but as a long-term investor, I still find 3.3% pretty impressive. If that’s the right figure, then I’m in.

Method 2. Barron’s reports the earnings yield on the S&P 500 as 5.74%. In 2005, after-tax corporate profits were 8.94% of US national income, compared to an average of 6.64% since 1948. Adjusting the latest earnings gives an earnings yield of 5.74% x (6.64/8.94) = 4.26%. The expected inflation rate is 2.5% (always). The 10-year Treasury yields 4.98%. The calculation 4.26% + 2.50% - 4.98% gives an estimated equity premium of 1.78%. If that’s the right figure then I’m out – way out.

Not that a 1.78% premium is really all that bad for a long-term investor, but I have some short-term concerns that would make me willing to risk missing out on a few years of 1.78% excess returns:
  1. With the premium so far below its historical average, I would expect some reversion. By reversion, I mean stock prices going down.

  2. Under this method, I’m assuming that corporate profits will revert to their historical fraction of national income. I’m guessing that when that happens, it won’t be a good time to own stock.

  3. I think Wall Street may be underestimating the chance of a recession.

  4. Nouriel Roubini provides a convincing set of parallels between today and 1987.

So, by method 1, stocks are a good deal for someone with my preferences. By method 2, they’re not. Taking an average, (3.33% + 1.78%) / 2 = 2.55%. At that price, I’m on the fence.

Labels: , , , , , ,

Sunday, August 13, 2006

The Profit Margin Puzzle

Take another look at this picture. Something screwy is going on. Labor costs have risen at an average rate of 1.5% over the past 15 years, but prices have risen at an average rate of more than 2%. That means labor is really cheap today compared to what it was 15 years ago. Why isn’t somebody hiring that cheap labor and undercutting competitors by charging lower prices (bringing down the rate of price growth, or bringing up the rate of labor cost growth by bidding more for labor)? I consider several explanations, but none seems quite satisfactory.

1. Rising raw material prices. If the cost of non-labor inputs is going up, then firms could be forced to raise prices even when labor is cheap. When you look at oil prices today, this seems like a good explanation, but take a look at this chart, which Barry Ritholtz found in a St. Louis Fed publication. Profits have risen dramatically as a share of national income, while compensation has fallen. If raw materials costs were the problem, we would expect them to be cutting into profits. Clearly they’re not, at least not in aggregate.

2. Increasing cost of capital. When economists talk about the “zero profit condition,” they are careful to distinguish economic profits from accounting profits. Accounting profits have clearly risen, but perhaps these profits just represent a higher required return on capital, not an increase in economic profit. This explanation fits well with the observation of a very low savings rate, which makes capital scarce. However, it is not consistent with the observation of a low interest rate. Obviously capital is still cheap for high-quality borrowers like the US government. Why would it be so expensive for businesses?

3. Increasing price of risk. The capital that gets compensated by profits is necessarily high-risk capital. Possibly, even though generic capital is cheap, the risk premium for equity capital has risen: investors have gotten more timid. If we compare today to 2000, this is almost certainly part of the story. But if we compare today to 1990, this argument is less compelling. Overall, price-earnings ratios have risen over the past 15-20 years, and dividend yields have fallen, which suggests people are more, not less, willing to invest in risky assets.

4. Rising rents. Some of what is counted as profits may actually be rents, and those rents may be rising. For example, an oil company that owns mineral rights continues to account for depletion based on original cost, even though the economic value of those rights has risen, so the implied rental cost shows up as profit. You could also argue that firms like Microsoft that own valuable intellectual property are earning large rents on that property, and those rents show up as profits. This explanation is more promising than some of the others. It’s certainly consistent with the observed unevenness of profits across sectors.

5. Reduced competition. Maybe the zero profit condition doesn’t apply any more. It’s hard to think of examples, though.

6. Product and labor market disequilibrium. Over the course of the business cycle, labor costs tend to rise during booms and fall during recessions, whereas prices rise more evenly throughout the cycle and perhaps accelerate before the boom phase is reached. If the Fed’s anti-inflation policies have made recessions more common than booms (“taking away the punch bowl before workers get to drink”), this could explain a shift of income away from labor. If this explanation is right, it bodes badly for profits in the future, because disequilibria tend to get corrected in the long run, no matter what the Fed does.

7. Capital market disequilibrium. Economic liberalization has resulted in a large increase in the effective global labor supply. According to classical economic theory, this should result in a (possibly temporary) increase in the cost of capital, as scarce capital is allocated toward the newly available labor. As noted earlier, observed low interest rates are not consistent with this story, but perhaps allocating capital is more complicated in the short run. Suppose, for example, that firms have a limit on the number of investment projects they can undertake at a given time. Even if capital is cheap, they won’t be able to take full advantage, but those projects they do undertake will be located where the plentiful labor is – i.e., not in the US. Thus the required return for US investments could be quite high (hence high US profits and high prices relative to wages) even if the raw cost of capital is low.

Labels: , , , , , , , ,

Saturday, August 12, 2006

Is the Fed Doing Too Good a Job?

An anonymous commentator suggests that maybe the Fed, in overzealous attempts to stabilize the economy, is mistaking noise for information:
It doesn't seem logical, to me, that deflation could have been a threat only a couple years ago whereas now the discussion is inflation…

My first response is, it sure doesn’t seem very logical, does it? But my second response is that, nonetheless, I don’t think the Fed is behaving irrationally given its objectives and its risk aversion. And my third response is that maybe the Fed is being too picky about its objectives.

The Fed’s main objective is price stability. By “price” it means, perhaps, the market-based core personal consumption deflator (which I’ll call the MBCPCD). By “stability” it means, perhaps, an expected growth rate that remains in the range of 1.5 to 2.0 percent. The chart below suggests, however, that the Fed’s definition of stability is even more precise. Since it’s hard to find data on forecasts for the MBCPCD, the chart below looks at forecasts (at a 10-year horizon) for the consumer price index (CPI), which tends to rise a bit faster than the MBCPCD. The series charted is the median forecast from a regular survey of forecasters conducted by the Philadelphia Fed.


Clearly I’ve been watching too much Grey’s Anatomy, because I look at the right side of this chart and think, “Time of death?” Inflation expectations used to be somewhat volatile, but the Fed has apparently succeeded in killing that volatility. Over the past 7 years, the median forecast has had a range of 10 basis points. Ceteris paribus, that stability is undoubtedly a good thing. But…

Perfection generally doesn’t come cheap. Surely there were tradeoffs to be made, and it looks like the Fed traded everything it had for stable inflation expectations. Stable inflation expectations – to within 10 basis points – may be a pearl of great price, but I doubt they are worth quite as much as the Kingdom of Heaven.

To take the most straightforward – though probably not the most important – example, surely the Fed could have made interest rates a little more stable without letting inflation expectations go too far out of bounds. I admit, I was cheering on the Fed’s antideflation policy in 2002 and 2003, but looking at this chart now, I’m thinking, surely the federal funds rate could have stopped at 1.5%, even at the cost of letting the CPI expectation fall to 2.4% or even (gasp!) 2.35%. And surely this year, it could have stopped at 4.5%, even if that meant markets would anticipate 2.6% or 2.65% inflation.

Labels: , , , ,

Friday, August 11, 2006

Q2 Labor Costs

By most indications US labor costs rose rapidly (by recent standards) in the second quarter. But something is wrong with this picture. Ordinarily one would like to attribute an increase in the price of something (labor, in this case) to either a leftward shift in the supply curve (decrease in supply) or a rightward shift in the demand curve (increase in demand). In the case of labor, there is no evidence that either of these things happened; indeed, the evidence suggests that the demand for labor declined.

I have noted before the dramatic decline in help wanted advertising. It is not matched by the official data on job openings; the latter are roughly flat but certainly show no sign of increasing. New hires, however, did decline in the official data. And aggregate payroll employment growth slowed to an average of 112,000 per month (not enough to keep up with recent average labor force growth) from 176,000 per month in the previous quarter (which is comparable to the average for the prior two years).

This apparent decline in the quantity demanded might suggest that the labor supply curve shifted. That is, there were fewer workers available at any given wage, so firms both raised wages and reduced hiring. But the direct evidence does not support this hypothesis. Labor force participation actually increased throughout the quarter (and also in July, so one cannot reasonably attribute the increases in May and June to sampling error). There was no increase in the rate of unemployment due to voluntary quits. There was a slight decrease in the overall unemployment rate, but the decrease was reversed in July.

Another explanation for rising wages might be an increase in inflation expectations, or a correction for price increases that had already occurred. The argument, I suppose, would be that employers deliberately raised wages because they realized that, given higher prices or higher expected inflation, they would need to do so to retain their desired workforce. Absent an actual increase in quits, however, I find this explanation implausible. If employers were so scared of quits that didn’t actually happen, why did they simultaneously reduce their help wanted advertising? If they decided to spend less on recruitment, why would they be willing to spend more on wages?

My guess is that the increase in labor costs will turn out to be a statistical illusion. Aggregate compensation per hour is reported to have risen at a 5.1% annualized rate for the business sector, but this number is subject to considerable revision. The employment cost index, which corrects for shifts across industry and occupation, shows an annualized increase of 3.6%, still high by recent standards but not quite as troubling. When incentive-paid occupations are excluded, the increase drops to 2.8%, which is roughly the trend growth rate of productivity.

Labels: , , , , , , ,

Thursday, August 10, 2006

Price Rule?


If the Fed is trying to follow a price rule for unit labor cost based on 1.5% annual growth, it appears they’ve been quite successful.

Labels: , , , , ,

Tuesday, August 08, 2006

Revised and Updated Labor Costs Still Tame

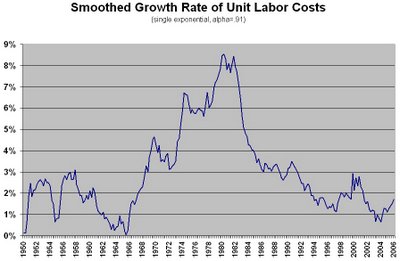
Some people will look at the new second quarter figure for unit labor cost in this morning’s productivity report and conclude that labor costs have become an inflation problem. Unit labor cost was up at 4% annual rate in the second quarter and up 3.1% from the same quarter a year ago. As I’ve said before, though, this series is volatile, and the appropriate way to analyze it is to smooth the quarterly changes. Taking into account the revisions and the latest update, my smoothed series now looks like this:


It stands at 1.7%, still quite close to the 1.5% center of the assumed hypothetical target range. In fact, on the off chance that the Fed really is targeting unit labor costs, let me offer my personal congratulations to each of the FOMC members right now for coming so close. Let me also say that, if I believed that the Fed were targeting unit labor costs, I would be pretty confident that we would not see any further interest rate increases, at least not in the next 3 months (and certainly not this afternoon). When the economy is facing a possible recession and your target number is right where you want it, you don’t push things. (As it is, I don’t think the Fed is targeting unit labor costs, and I think there’s actually a significant chance of an increase this afternoon, contrary to the current consensus.)

You might want to look more closely at the second quarter figure. One reason it was so high is that productivity growth was slow. In general, one wouldn’t expect that weak productivity growth in a particular quarter means we should expect weak productivity growth in the future. Applying my smoother to productivity growth, I get a rate of 2.7%, compared to the 1.1% reported for the second quarter. So if we use trend productivity growth instead of the quarterly observation, that shaves 1.6 percentage points off that ugly 4% and leaves us with 2.4%, a much less alarming number.

The other side of the picture is compensation growth. Nominal hourly compensation grew quite rapidly (5.1% annual rate) in the second quarter. Does anyone expect it to keep growing at that rate? I certainly don’t, not after the recent huge drop in help wanted advertising.

Labels: , , , , , ,

Monday, August 07, 2006

Feldstein’s Deceptive Statistics

According to Martin Feldstein, writing in today’s (Monday) Wall Street Journal (in an op-ed piece cited variously by Greg Mankiw, Brad DeLong, Mark Thoma, and William Polley, among undoubtedly many others):

The result of the slower productivity growth and rising compensation per hour (from a 4% rate in 2003 to 5.1% in 2005) caused the increase in unit labor costs to accelerate from 1.3% in 2003 to 2.1% in 2004 and 2.8% in 2005.


These numbers don’t quite agree with what I just downloaded from the BLS, but they tell roughly the same story if you take them at face value. Unfortunately, the face value is deceptive. As best I can tell, these numbers compare annual aggregates from one year to the next. If you look more closely and examine the quarterly data, the story they tell is very different.

In the third quarter of 2003, there was a dramatic and unexpected increase in productivity. Unit labor costs fell by about 4% in one quarter, which depressed their growth rate for both 2003 and 2004, if you compare each annual aggregate to the previous year. In the third and fourth quarters of 2004, there were dramatic increases in hourly compensation, which appear to be the result of a combination of rising benefit costs and a shift in employment toward higher paying jobs. These increases in hourly compensation exaggerated the growth rate of unit labor costs for 2005, as compared to 2004.

If you look at unit labor costs on a fourth-quarter-to-fourth-quarter basis, rather than a year-to-year basis, the pattern of acceleration is revealed as a statistical illusion. The growth rate was about 0.3% in 2003, about 3.5% in 2004, and about 0.3% in 2005.

Of course, the right way to analyze these data is neither by comparing years to years nor by comparing fourth quarters to fourth quarters, but by smoothing the quarterly data over time to extract an estimate of the general trend. Any reasonable smoothing procedure (such as the one I used in the previous post) will show that there is no clear pattern of acceleration. (Possibly that will change with tomorrow’s revisions, but I doubt the change will be dramatic.) There are plenty of reasons to worry about inflation in the prices of goods and services, but as of this afternoon, there is still no reason to worry about inflation in labor costs.

Labels: , , , , , ,

What would happen if the Fed were targeting unit labor costs?

…as it should

For one thing, people like me wouldn’t be so panicked about stagflation right now. When you hear about the CPI and the PCE deflator, things look bad, but when you look at unit labor costs, it’s just another ordinary day. I reserve judgment, though, on whether we’ll be panicked tomorrow morning, when the second quarter productivity report comes out.

Also, people like Brad DeLong wouldn’t be so worried about import prices. Import prices don’t directly influence US labor costs, and presumably, if the Fed made a credible commitment to stabilizing labor costs, then workers would see that it is not in their interests to demand pay raises to compensate for import price increases.

Incidentally, the Fed might have started to tighten more quickly during the early part of 2005, after a couple of unpleasant unit labor cost numbers came out. In retrospect, that would have been a good time to tighten. However, the Fed might also have recognized that those numbers were just temporary problems. The subsequent inflation problems seem to be for different reasons (rising oil prices, mostly).

To put things in perspective, here is a chart of smoothed unit labor cost growth. (I used a logarithmic growth rate and chose an exponential smoothing parameter to maximize predictive accuracy at a 4-quarter horizon.)


Historically, things start to get ugly in 1969, with a breakout above 3%; they get uglier in 1974 with a breakout above 5%, and uglier still in 1979 with a breakout above 7%. Today, however, nothing unpleasant seems to be going on: this series remains near the bottom end of its historical range. (The situation may change tomorrow, but, given my smoothing parameter, the change is unlikely to be dramatic.) So, what would happen if the fed were targeting unit labor costs? Well, if the target growth range were 1% to 2% (as contemporary opinion suggests it might be), then we would congratulate the Fed for doing such a good job.

Labels: , , , , ,

Sunday, August 06, 2006

Should the Fed Target Unit Labor Costs?

Yes, if you ask me. I would suggest using unit labor costs as the ultimate target of Fed policy, not just as an indicator to watch for signs of inflation. In fact, I think an explicitly announced long-term target might be a good idea (better than an inflation target).

Why should the Fed choose unit labor costs as a target?

1. It’s simple. There are no subtle debates required about things like “Should we include energy?” and “Should we exclude housing?”

2. It avoids wage-price spirals. When the spiral hits wages, it gets nipped in the bud.

3. It avoids “bad sunspots.” That is, it never gives reason to lose confidence in the value of money, since it ties the value of money to the labor content of goods and services. (Avoiding “bad sunspots” is the most basic rationale for having some sort of target in the first place.)

4. It achieves “greasing the wheels” (provided that productivity growth is consistently non-negative and the target growth rate for unit labor costs is positive). In other words, in most cases, it makes nominal wage cuts unnecessary and thereby avoids the situation where firms reduce employment because they doubt workers would accept such wage cuts.

5. It allows the Fed to accommodate external supply shocks, so that such shocks (hopefully) don’t produce recessions.

6. It allows the Fed to provide a stimulus to take full advantage during times of rapid productivity growth.


There are a couple of drawbacks I can think of, but they don’t bother me much:

1. The data series has unpleasant characteristics. It is reported with a lag, subject to revision, and volatile from quarter to quarter. This would be a big problem for an intermediate indicator, but not so much for an ultimate target. The important thing is that the long-term trend be predictable, and in this respect, unit labor costs is probably no worse than any other series.

2. In the event of a persistent supply shock (such as the recent experience with oil prices, if that experience continues), this approach would allow persistent inflation. And my response is, “So what?” Inflation is mildly unpleasant, but the alternative of economic stagnation is highly unpleasant. On welfare grounds, it makes no sense to insist that the inflation rate always be low. If individuals are worried about inflation risk, they can buy insurance, probably at prices which (as suggested by TIPS spreads) would be very reasonable. (Of course, if such insurance is never offered, because there is no market for it, that just makes my point that inflation risk is not such a big deal.)

Labels: , , , , ,

Saturday, August 05, 2006

Not the End of the World

Now that we’re going to have a recession, the question arises as to how we are going to get out of it. “With great difficulty,” seems to be the consensus. Getting out of a recession is seldom easy, but I think some commentators have exaggerated the difficulties involved this time around. In particular, Brad DeLong (quoted by Mark Thoma) is pessimistic about the options the US would have available should it fall into a recession (for which he puts the odds at about 30%, although he doesn’t make much of a case for the remaining 70%). The rest of this post reproduces (on mvpy's suggestion) a comment I made on Mark Thoma’s entry above. First, citing Professor DeLong regarding the prospects for a monetary solution:

… sharp reductions in interest rates would lower the value of the dollar and increase inflationary pressures from import prices in a way that the Federal Reserve does not dare allow.


This is a controversial point, and Brad is going out on a bit of a limb here. First of all, many imports are priced in dollars, and many of those that aren’t literally so are effectively priced in dollars because the prices get adjusted according to the prices of dollar-priced competitors. Brad remembers as well as anyone how adamantly foreign producers tried to defend their US market shares during the dollar declines of the late 1980s.

Second, policymakers in foreign countries that depend on US demand or compete heavily with the US aren’t likely to allow dramatic appreciation in their currencies. The Asian countries just won’t let it happen. Europe may let it begin to happen, but when their economies start to decline due to US competition and their inflation rates decline due to a strong Euro, the ECB will ease up and allow the dollar to appreciate again (and, in fact, traders will anticipate this action and forestall a dramatic rise in the Euro to begin with). Moreover, the Fed will anticipate these foreign responses and therefore will not be tremendously concerned with the value of the dollar until they actually see the inflation rate rising because of it (which it may never do, for this and all the other reasons described here).

Third, with the US economy in recession, with the Fed’s inflation-fighting credibility high (as it will be, if the Fed manages to cause a recession), and with an extremely weak US labor market (much weaker, because of the recession, than the already very weak labor market today), there will be dramatic domestic disinflationary pressures to offset any inflationary pressure from imports.

Fourth, in the event of a US recession, those imports (such as oil) that have volatile prices will (along with everything else) experience a drop in demand, which will put downward pressure on prices and tend to offset the effect of the weak dollar.

Finally, to the extent that import prices do rise, and export prices fall in terms of foreign currencies, this will be an excellent stimulus for the US economy. Like any economic stimulus, a weak dollar also tends to be inflationary, but it is not reasonable to assume that its inflationary impact would be out of proportion with its stimulative impact. You wouldn’t say, “Sharp reductions in interest rates would increase demand for building materials and construction workers and thus produce inflationary pressures that the Fed doesn’t dare allow.” During a recession, the Fed does dare allow inflationary pressures, because they are offset by the disinflationary impact of the recession itself.

Labels: , , , ,

Friday, August 04, 2006

This Business Cycle is Over

[I wrote this last night, when I was in a bolder mood, perhaps, and when the unemployment rate was 0.2% lower than it was this morning. After today's employment report, perhaps the Fed will pause, if only because there is evidence that the hard landing is already beginning to play itself out. But FWIW, here it is.]


Yes, the Fed will raise interest rates this month, and yes, there will be a recession, or at least a severe slowdown that nobody will mistake for a soft landing.

Having thought this through, I realize that the Fed has no wiggle room. Financial markets may have confidence in the Fed, but it’s not the financial markets that the Fed needs to convince. After the price increases that have happened during the past few months, if Bernanke wants to keep the inflation rate below 2% for the rest of his term, he has to say to companies like Procter and Gamble, “Don’t you dare pull this crap again!” He has to make them regret raising prices. If the slaves are to learn to obey, at least one of them must be publicly whipped. And the only way the Fed can conduct a public whipping is by whipping the whole economy until it bleeds. (Whether the NBER subsequently decides to apply the term “recession” is really not much of an issue.)

There is a loophole, however. It’s a loophole that I personally would be willing to apply if I were in Bernanke’s position. (Of course, if I were in Bernanke’s position, my inflation target would be a bit higher than the 1%-2% range conventionally attributed to Bernanke and others at the Fed – but that’s another story.) The loophole is this: you are permitted to raise prices if all you’re doing is passing through cost increases that result from supply shocks outside the control of domestic firms and workers. But there are a couple of reasons that Bernanke won’t apply this loophole. First, with the unemployment rate comfortably below 5% and nominal wage growth finally accelerating, Bernanke will not be willing to assume that the price increases resulted from supply shocks. Second, with corporate profits already at a record, US firms can (collectively, though not in all individual cases) afford to absorb the supply shocks: you don’t get to raise prices just to maintain profit margins that are (on average) already high by historical standards.

So the Fed will keep raising interest rates until one of two things happens: the inflation rate comes back down or the economy buckles. Both will happen eventually; the latter will probably happen first; indeed, the signs could be in place before the subsequent Fed meeting. Meanwhile, however, it will not do simply to hope that the tightening so far has been enough (even though, in my opinion, it has). The slowdown needs to be a virtual certainty. The newly employed slave driver cannot risk being unintentionally lenient.

Labels: , , , ,

Thursday, August 03, 2006

Scary Monster

The Monster Employment Index (which tracks online help wanted advertising) came out today, and it’s not pretty (not one of those cuddly Sesame Street monsters). The index dropped from 171 to 165 between June and July. According to the report, there was “similar seasonal retraction observed in July 2005 and July 2004,” but the similarity was clearly only in the direction and not in the size. In July 2004, the index dropped by 1 point; in July 2005, by 2 points; in July 2006, by 6 points. In fact this was, by a margin of 2 points, the biggest one month drop in the 33-month history of the index. It’s also the first year that the index was lower (by 2 points) in July than it was in May.

In and of itself, this observation wouldn’t be particularly worrisome, since the index has had a nice run up and perhaps deserves a rest, but I was hoping for some good news about online advertising, to offset the distinctly bad news we’ve had about print advertising. The Conference Board’s Help Wanted Index dropped from 39 to 33 between February and May and remained at 33 in June. (The July index won’t be released until the end of this month.) The Monster index rose from 157 to 171 over that same period, which was a hopeful sign for those who want to believe that the US is not headed into a recession.

But with Monster back at 165, the situation is looking ugly. The net 8 point increase between February and July compares with 12 point increases for the same period in each of 2004 and 2005. Government data suggest that a substantial net increase in job openings is normal between February and July, but even if we ignore seasonal factors and credit the full 8 points, this doesn’t begin to make up for the drop in print advertising. This is a 5% increase in online advertising vs. a 15% drop in print advertising, while print advertising still has about 70% market share. You do the math.

Labels: , , , , ,

Wednesday, August 02, 2006

Bubble? No. Crash? Yes.

Listen closely to the US housing market. At first, you may think you hear a hissing sound, but what I hear are the wheels of a moderately efficient market grinding out a new equilibrium price. By my very rough estimate, the fundamental value of the average US house has fallen by about 15% over the past year.

A house represents a stream of housing services, and the value of the house depends on the rate at which you discount those services. Since housing services can also be purchased with money (rent), the discount rate for housing services has to maintain some relationship with the discount rate for money (the interest rate, which, as you may have noticed, has been rising lately).

In a post last year, James Hamilton goes into more detail on the basic mathematics of house pricing and ends up with the formula H = s/(i-g), where H is the house price, s is the value of housing services (rent), i is the interest rate, and g is the growth rate in the value of housing services. In my calculations, I assume that the growth rate is equal to the inflation rate, so the formula simplifies to H = s/r, where r is the real (inflation-adjusted) interest rate.

What real interest rate, in particular? There is no easy answer, but to make things simple, I just take the (easily observable) 10-year TIPS yield and add a 2% risk premium. 2% corresponds roughly to the typical spread between 30-year mortgage APRs and 10-year treasury yields. A subtle housing economist would also account for a lot of other details, such as maintenance costs and tax deductions, but I just want to look at the big picture, so I’ll assume that those things net out to zero.

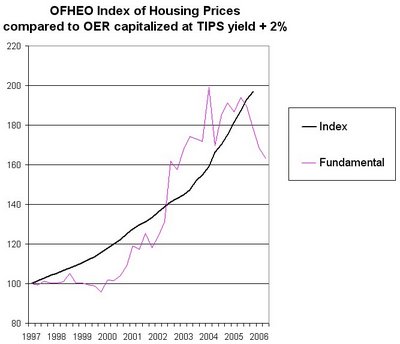
Using the CPI for Owner’s Equivalent Rent, I calculated the path of this “fundamental value” (H) since 1997 (when TIPS were first issued) and compared it to the path the OFHEO house price index. (Both numbers are indexed to start at 100.) The chart below shows the result.


Housing prices did roar ahead of the fundamental during the economic boom of the late 1990s, but with the decline in interest rates starting in 2001, the fundamentals caught up with prices and then pulled ahead. From 2003 to 2005, actual prices were catching up with fundamentals. By the first quarter of 2006 (the last data point from OFHEO), prices were just slightly above the fundamental (not what I would call a bubble!), but in the subsequent two quarters, with interest rates rising, the fundamental has dropped dramatically. As a fundamentalist who never bought the bubble story, I won’t be at all surprised to see housing prices drop (in real terms, certainly, and perhaps in nominal terms as well) over the coming months and years.

Labels: , , , , ,

Tuesday, August 01, 2006

Stagflation

Two things to notice about today’s Personal Income and Outlays report:

1. The savings rate went up (that is, became less negative) for the first time this year. We should perhaps take this with a grain of salt, since this isn’t the first time that it has risen for the first time: the February and March reports were subsequently revised to show the savings rate falling deeper into negative territory. Nonetheless, given the recent decline in retail employment, I’m betting that this one sticks. For the third month in a row, real personal consumption has risen by only 0.2 percent.

2. The 12-month change in the market-based core consumption deflator reached the magical 2 percent number. According to some observers, this is the Fed’s favorite inflation indicator, and 2 percent is the top of the Fed’s comfort zone.

Labels: , , , ,