Thursday, September 18, 2008

How many people have lost their jobs?

According to Barack Obama, 600 thousand Americans have lost their jobs since January. Actually, he's wrong: something like 20 million Americans have lost their jobs since January. It's just that most of them found new jobs. Probably the new jobs generally weren't as good as the ones they lost. And almost certainly, more than 600 thousand of them were unable to find new jobs, because many of the new jobs created were filled by new entrants to the labor force or by people who were already unemployed when the year began.

Like almost everyone else I've ever heard, Senator Obama is making the mistake of using a net job loss figure with language that, if taken in its plain sense, clearly implies he is talking about gross job loss. And it seems to me that gross job loss is the appropriate concept: losing your job is a pretty serious bummer, even if you are able to find a new one after a few months.

There has been a lot of talk about Senator McCain and how he has been saying things that aren't true in order benefit himself politically. It turns out that Senator Obama is also (obviously unintentionally) saying things that aren't true, but in this case they benefit his opponent.

Labels: , , , , ,

Friday, April 13, 2007

Bad Luck

As Bruce Bartlett will tell you, the conventional wisdom among Keynesians during the 1970s was that the rising inflation rate in the US during that decade was primarily the result of a string of unlucky events – oil shocks, a bad anchovy harvest, and so on. Among Keynesians today, the conventional wisdom is that their predecessors were wrong and that the rising inflation rate during the 1970s resulted from excessively loose policy. The problem is, from a Keynesian point of view, today’s conventional wisdom doesn’t make quantitative sense.

Under the Keynesian paradigm, a loose policy can be defined as one that tends to push the unemployment rate below the non-accelerating inflation rate of unemployment (NAIRU), so that inflation will tend to accelerate. Conversely, a tight policy can be defined as one that tends to push the unemployment rate above the NAIRU, so that inflation will tend to decelerate. Whether the unemployment rate is in “loose” or “tight” territory, the economy will be subject to shocks (bad luck – or good luck), which may cause the inflation rate to do something else, but these shocks cannot be blamed on (or credited to) policy. (Also, there may be shocks in the policy transmission process that prevent the unemployment rate from reaching its intended level in the first place, but these aren’t the type of shocks that people have in mind when discussing the 1970s.)

The average unemployment rate for the US during the 1970s was 6.2%. Until the mid-1990s, conventional estimates put the NAIRU at about 6%. Using the conventional linear approximation to the Phillips curve, this means that policy, on average, managed to push the unemployment rate to a level that should have resulted in a slight decline in the inflation rate. On average, policy was tight, not loose.

If anything, this simple analysis underestimates the extent to which policy was tight. The 6% NAIRU estimate came with full benefit of hindsight. An estimate produced using data available during the mid-70s would put the NAIRU somewhat lower. So if we describe policy in terms of its actual intentions, rather than the results that might have been anticipated with benefit of hindsight, it was more than a little tight.

This is not to say that policymakers (meaning the Fed) necessarily acted appropriately during the 1970s. Perhaps, in the interest of restoring the credibility they lost during the Johnson-Nixon years, they should subsequently have been even tighter than they were. Perhaps high inflation is just bad and should have been met aggressively at every turn, even when it was not the result of recent policy. But leaving these normative issues aside, it’s hard (at least if we accept the Keynesian paradigm) to see how, in the absence of considerable bad luck, the inflation rate at the end of the 1970s could have been so much higher than it was at the beginning. Did anyone notice a black cat on Constitution Avenue?

Labels: , , , , , , ,

Thursday, March 01, 2007

Typology of Anti-NAIRUvians

The NAIRU Theory or Natural Rate Theory of Unemployment essentially consists of two propositions about the Phillips curve (the relationship between inflation and unemployment as nominal aggregate demand* varies):
  1. The Phillips curve is downward-sloping in the short run.
  2. The Phillips curve is vertical (or possibly upward-sloping) in the long run.
Accordingly, there are essentially four ways to challenge the theory:
  1. Argue that the Phillips curve is vertical in the short run, as in many real business cycle models.
  2. Argue that the Phillips curve is horizontal in the short run, as in my suggestion here
  3. Argue that the Phillips curve is downward-sloping in the long run, as in Tobin’s “greasing the wheels” theory.
  4. Argue that the Phillips curve has the required NAIRU properties in theory but that it is so unstable and unpredictable as to render the concept useless in practice. (This seems to be roughly the argument made by Bob Hall recently.)
(I have ignored the possibility of an upward-sloping short-run Phillips curve because it just seems too silly to me. Any upward-sloping short-run Phillips curve that anyone is likely to advocate will either be approximately vertical or approximately horizontal.)

It is clear that these different challenges to the NAIRU theory have very different policy implications. For example, if you believe challenge #1, you might argue for aggressive policy tightening in response to any increase in the inflation rate above your preferred target, whereas if you believe challenge #3, you might argue for no tightening at all. And while challenge #4 is perhaps the most viable, it also raises the question of what alternative one might use to guide policy, and if there is no viable alternative, one has to wonder how Fed policy has managed to be so successful over the past 20 years. Anyhow, it is incumbent upon those who challenge the NAIRU theory to identify the specific nature of their challenge.


* I use the word “nominal” to accommodate those who don’t believe in the concept of aggregate demand. If you don’t like the phrase “aggregate demand,” how about “velocity-adjusted nominal money supply.”

Labels: , , , , ,

Wednesday, October 11, 2006

Nobel Topic

Edmund Phelps wins the Nobel Memorial Prize “for his analysis of intertemporal tradeoffs in macroeconomic policy,” and it takes me two whole days to realize that this is the perfect opportunity to resurrect all my old posts about the NAIRU. (Prof. Phelps invented it, kind of.) OK: here*, here, here, here, here, here, and here (and see the links and the comments to those posts). Or just read the June archives.

More recently, the topic of the Phillips curve has come up (in August) here, here, and here. The point is that Prof. Phelps’ research, and the subsequent acceptance of much of his conclusion, did not eliminate the Phillips curve concept; it merely revised the concept.

The posts from June relate to a more recent attack on the “post-Phelpsian” Phillips curve (possibly with the intent of reinstating the “pre-Phelpsian” Phillips curve, although it’s never quite clear to me). As argued recently by Dean Baker, the NAIRU doesn’t work any more (witness the late 1990s, when the unemployment rate went far below the consensus NAIRU without sparking inflation). In my real-life personality, however, I was arguing as far back as 1994 (along with a few others) that the US NAIRU was falling. As an “out-of-consensus NAIRU guy,” I have never been obliged to discard the NAIRU theory or to come up with extraordinary means of life support for it. By my measures, it did just fine in the late 90s.

But maybe I speak to soon. By my measures, the NAIRU today is about 4%, but the unemployment rate is well above 4%, and yet it appears that inflation is accelerating. My explanation, of course, is that oil prices are the problem. But oil prices are much less of a problem now than they were a few months ago. Circumstances are forcing me to make a falsifiable prediction here: the core inflation rate will come down. When you notice that the core inflation rate is coming down faster than expected, you’ll see that my version of the NAIRU theory has been vindicated. Or else it won’t, and you won’t, and I’ll have to come up with a new theory….


*If you want to follow the argument in my first link above, it’s important to look at the first link within, which leads here, and then click on "Comments" at the bottom of that link. But pay no attention to the woman behind the screen. The blogger formerly known as Angelica is now the retroactively anonymous Battlepanda. (The discussion from the cited post also continues here, which I’m sure is linked in one of my posts above also.)

Labels: , , , , ,

Monday, August 28, 2006

Phillips Curve

In Arthur Laffer’s case, it might have been carelessness in the use of words, but the latest attack on the Phillips curve by Larry Kudlow (discussed by Mark Thoma and pgl) is unmistakably either disingenuous or ignorant. (I'd prefer not to use such inflammatory terms, but I just can't think of a nice way to say it.) I single out Larry Kudlow only because his is the most recent example. I’ve heard similar arguments in the past, and I’m never sure whether the people making the argument realize that they are attacking a straw man – a man made completely of straw, that is, with no hope of even finding the Yellow Brick Road. But it’s one or the other: either Larry Kudlow is trying to pull the wool over people’s eyes, or he is somehow unaware of the last 40 years of Phillips curve research.

His argument essentially goes like this: the Phillips curve is an inverse relationship between unemployment and inflation. What we observe, however, is that the relationship is positive, not inverse. Therefore the Phillips curve is wrong.

That might be a strong argument against the version of the Phillips curve that was widely believed during the 1960s (the “groovey” Phillips curve, as Gabriel Mihalache called it in an earlier comment). That version posited a stable relationship between the unemployment rate and the level of inflation, the same relationship in the long run as in the short run. The problem is, nobody believes in that version of the Phillips curve any more. Don’t even bother looking in the duffle bag. That argument was settled conclusively before Bill Gates dropped out of college.

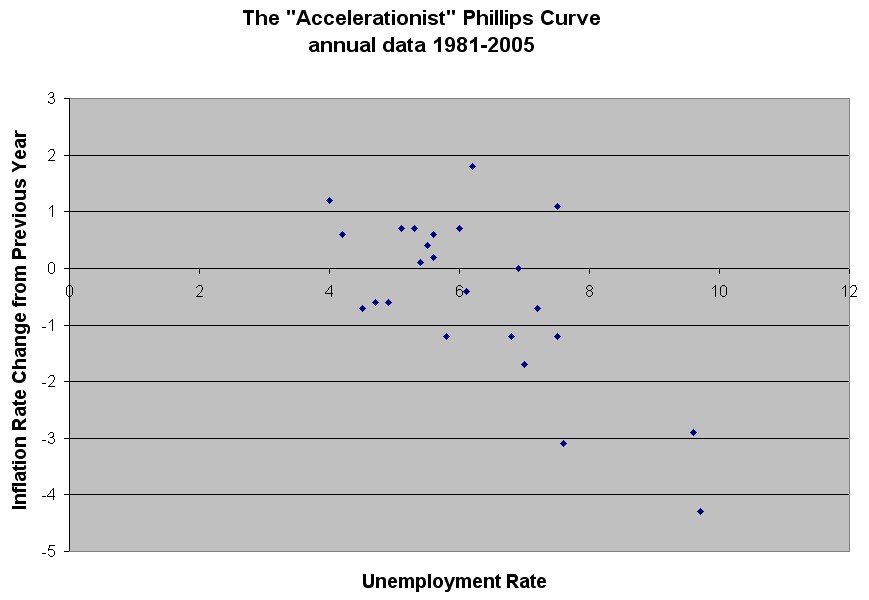
For practical purposes, the Phillips curve – the version that is used to guide forecasts and generate policy prescriptions today – is not a relationship between unemployment and the level of inflation; it is a relationship between unemployment and the change in the inflation rate. (There are subtle reasons why this practical definition isn’t exactly right, but for such a simple formulation, it comes awfully close. Econometrically speaking, the Phillips curves fit by people like empirical Phillips curve guru Robert Gordon have exactly this “accelerationist” property.)

So let’s look at the data. Suppose we don’t even bother with all the econometric subtleties that people like Robert Gordon and Mark Thoma would urge upon us. Suppose we just do a straight scatterplot. Here it is:


I don’t know about you, but that sure looks like an inverse relationship to me. Want to include the 1970s? OK.

Labels: , , , ,

Friday, August 25, 2006

What is Inflation?

I’m not sure what combination of carelessness, ignorance, malice, and/or rhetorical convenience causes Arthur Laffer to mischaracterize the Phillips curve, but…maybe I should be nicer, since I actually agree with Laffer’s main point.

Laffer is countering a view recently expressed several times on the same Opinion page (including by the Journal’s editors). Essentially, the argument he is rebutting goes something like this: “Prices are rising. Thus by definition we have inflation. The Fed should keep tightening in order to get rid of this inflation, before it becomes embedded in the system. The Fed has stopped tightening only because it sees (or expects) a slowdown, and because it believes in the Phillips curve, which says that a slowdown will reduce inflation. But we all know that the Phillips curve is a bunch of crap.”

Laffer begins his response by saying, in my broad paraphrase, “Ah, yes, we all do know that the Phillips curve is a bunch of crap, but…” He gets to the point by the end of the second paragraph (now I’m quoting literally):
…to confuse an increase in commodity prices with general inflation is a serious mistake, one which often seduces otherwise clear-thinking economists.

(I guess by “clear-thinking economists” he means those top-of-the-duffle-bag folks who don’t believe in such nonsense as the Phillips curve – a category which, as Donald Luskin points out, excludes the current Fed chairman. But I think a few of my fellow bottom-of-the-bag Keynesians might be confused as well.) I don’t agree with everything Laffer says subsequently (for example, why are “further declines in the dollar…not very likely,” considering that, after all, the “U.S. global capital surplus” that occasioned the decline has only gotten bigger?), but I take his main point to be about the definition of inflation.

The word “inflation” is essentially a metaphor: pushing money into the economy to produce higher prices is like blowing air into a balloon; it doesn’t add to the substance, but it makes the balloon look bigger. As a Keynesian, I do believe there are a lot of subtleties in the process: for example, the money doesn’t have to be pushed by the Fed or even by the banking system; it could be an increase in “velocity” occasioned by changes in preferences or “animal spirits.” And the economy doesn’t work quite like a balloon, because pushing money can in some cases increase the substance (because of sticky prices and wages). Thus I don’t think that growth in the monetary base, which Laffer charts, is a sufficient indicator of whether or not the Fed’s policy is inflationary.

But let me return to the metaphor. If the prices of volatile commodities are rising, and the prices of finished goods and services are rising at a slower rate than would be warranted by their commodity content (which is to say, the price of value added above those component commodities is not rising, at least not any faster than is considered normal), how does this resemble a balloon blowing up? Most of the balloon is not expanding. And if you examine the role of money, the flattening of the monetary base at the top of Laffer’s chart has actually had the effect of raising prices, by putting upward pressure on rental costs. It’s a very odd balloon that expands when you let the air out! It seems that, if we interpret the word “inflation” in keeping with this metaphorical etymology, it surely does not describe what is happening today.

Labels: , , , , ,

Thursday, August 24, 2006

Dangerous Curve

Arthur Laffer, on the opinion page of today’s Wall Street Journal (hat tip to Dave Altig), writes:

You'd have to dig pretty far down in the duffle bag of economists to find one who actually believes in the Philips Curve-- the idea that rapid growth causes inflation.

It appears that, all these years that I’ve been studying the Phillips curve, I’ve been under a wrong impression about what the Phillips curve was. You see, naïve as I was, I thought that demand was the causal factor. I thought that excess demand caused both faster growth and rising inflation rates. I had this crazy idea that maybe, faced with excess demand, firms would both raise prices and increase production, thus increasing the inflation rate and increasing the growth of output at the same time. And I also thought that this excess demand would give firms a reason to hire more workers, even if they had to pay higher wages to do so, so the unemployment rate would fall and wages would rise. Seems like a pretty reasonable theory to me; I doubt you would have to dig very far down in the duffle bag to find an economist who believes it. But apparently, this is not what the Phillips curve is about.

No, according to Laffer, the Phillips curve is the idea that growth itself causes inflation. That is a really dumb theory. No wonder so few of us actually believe it. All this time I thought I believed in the Phillips curve, when actually what I believed was something quite different.

Labels: , , , ,

Sunday, June 18, 2006

The Non-Accelerating Inflation Range of Unemployment

Hopefully my last two posts on the subject have made it clear that I am ready, willing, and able to defend the theory of a Non-Accelerating Inflation Rate of Unemployment, not just as “the best of a bad lot” but as a worthwhile theory in and of itself. Having declared victory, I am now getting out. Herewith I renounce the Non-Accelerating Inflation Rate of Unemployment. Le NAIRU est mort.

Vive le NAIRU! As we bury the theory, we need not also bury the acronym. Rather, let me suggest that there is a range of unemployment rates that is compatible with stable inflation: the Non-Accelerating Inflation Range of Unemployment. I’m not sure who coined that phrase, but I associate it with Harvard labor economist James Medoff. (A Google search on the phrase turns up nothing of interest.)

If the unemployment rate goes above the NAIRU range, the inflation rate declines. If it goes below, the inflation rate rises. If it stays within the range, the inflation rate remains the same, except for random changes and responses to external shocks.

It is a theory with which, it seems to me, almost everyone will eventually have to agree. It is proven by thought experiment and historical experience. Even the most ardent “Old Keynesian” or real business cycle advocate will have to acknowledge that, if we push unemployment far enough below the full-employment level, the inflation rate will start to rise fairly rapidly. To put it conversely, an inflationary monetary policy will initially push unemployment below the full-employment level. Some may deny the possibility of pushing unemployment below the full-employment level, but it seems to me that the late 1960s provide an example.

On the other side, even the most ardent Laxtonite advocate of the convex Phillips curve will have to acknowledge that, if we push unemployment high enough, we will get fairly rapid disinflation – or conversely, that there are limits to the unemployment effects of even the most draconian disinflaitonary (or deflationary) policy. The early 1980s would seem to provide an example. I might also cite the rapidity with which deflation materialized during the early 1930s, as well as the relatively small absolute unemployment increase in 1990s Japan.

And there is surely some range of unemployment in the middle that is compatible with stable inflation. Traditional NAIRU people may still claim that the range is degenerate, just a single point, but the experience of the late 1990s makes that claim very difficult to maintain.

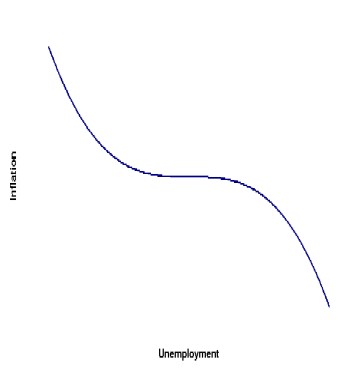
What I’m suggesting is a Phillips curve that is convex on the left side and concave on the right side, like the shape depicted below. For extremely low unemployment rates – near zero – we are in hyperinflationary territory. As we consider gradually higher unemployment rates, the inflation rate first falls quickly toward “ordinary high inflation,” then more slowly down to the expected inflation rate, where it essentially remains over a certain range. Subsequently, as we consider gradually higher unemployment rates above the NAIRU, the inflation rate falls slowly, then more quickly, then very quickly into the deflation zone.

Labels: , , , , ,

Friday, June 16, 2006

The NAIRU is 3.9%

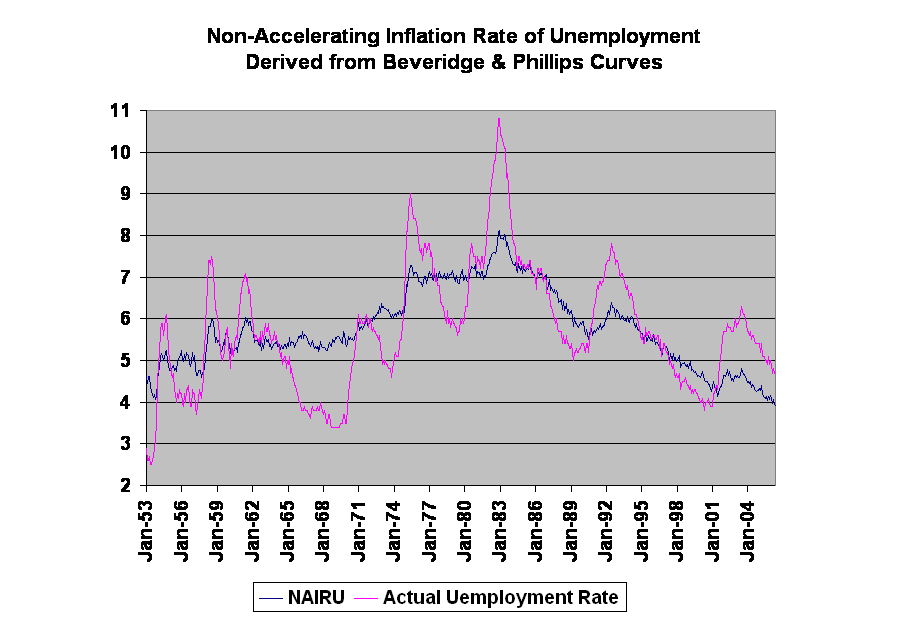
The constant term in the Phillips curve specification no longer makes sense when there is a vacancy term included to offset the unemployment term. (See the comments section of my previous post on the subject.) My new specification, and a slight correction to the April 2006 data point, results in a NAIRU of 3.9%. The chart below (click on image for a better picture) shows what has happened to it over time, based on a single Phillips curve fit and a constant-slope Beveridge curve which shifts continuously. The results are surprisingly consistent with actual monetary policy (except over the past year, but lately energy price concerns might outweigh NAIRU concerns).


Labels: , , , , ,

Wednesday, June 14, 2006

The NAIRU is 4.3%

One problem with using the NAIRU as a guide to policy is that most analyses do not include a useful theory of how and why the NAIRU shifts over time. By now, everyone acknowledges that it does shift. Otherwise the late 1970s and the late 1990s (as experienced by the US) could not have happened in the same country. Unfortunately, the usual way of dealing with these shifts is to treat them as a purely empirical phenomenon. The problem with that approach is that we don’t find out about the shifts until long after they happen.

Here I will make the bold claim to have a useful theory of NAIRU shifts. It’s not a new theory, really, but it has, in my opinion, gotten a lot less attention than it deserves (and as a result, the whole NAIRU concept has gotten more abuse than it deserves). The idea is that inflationary pressure from the labor market is determined by the relationship between the number of unemployed workers and the number of available jobs. In general, the more jobs there are available, the more inflationary a given level of unemployment will be. If only a few firms want to hire, for example, then most firms will not have occasion to raise wages even if the unemployment rate gets quite low.

The specific relationship between unemployment, job vacancies, and inflation can be estimated empirically by including a job vacancy variable in a standard Phillips curve specification. The Phillips curve results can be combined with information about the Beveridge curve – the inverse relationship between unemployment and job vacancies over the business cycle – to provide an estimate of what unemployment rate is consistent with stable inflation, and voila: the NAIRU!

It so happens I’ve done just that. The whole procedure isn’t very fancy, but I think it provides a sensible first cut. My Phillips curve has no control variables. (It does have a third-order polynomial distributed lag on past inflation and a constraint that the coefficients sum to one – the latter necessary to identify the NAIRU.) The proxy for job vacancies is based on a combination of the Conference Board Help Wanted Index and the Monster Employment Index. (I won’t go into the details of how I combine them, but the Conference Board index usually dominates, because newspapers still have the lion’s share of the want ad market.) I use a purely visual process to ascertain the normal slope of the Beveridge curve, because I don’t have time right now for the fancy econometrics needed to estimate a shifting relationship between two noisy variables. (I assume that all shifts in the Beveridge curve are parallel shifts.) I use monthly data going back to 1953.

As expected, both unemployment and job vacancies are highly significant in the Phillips curve. I took a line through the data point for March 2006 to represent the current position of the Beveridge curve. Conclusion: See the title of this post.

Labels: , , , , ,

Saturday, June 10, 2006

Walking with Keynes

As an alternative to the NAIRU (see these earlier posts and links and explanation), James K. Galbraith argues for an “Old Keynesian” paradigm, in which

full employment was not inherently inflationary; in fact, we saw the greater inflation risk in stagnation itself. In a slowdown, we believe, monopolistic enterprises raise prices in order to try to recover their fixed costs. While on the other hand, full employment production foments ample competition in product markets, high rates of technical change, and declining costs, as businesses seek ways to save on scarce and expensive labor. In other words, productivity growth accelerates because of full employment itself.


I see various difficulties with this point of view. For one thing, slowdowns historically have typically been associated with declining inflation rates, not rising inflation rates. There has been “stagflation,” but generally the “flation” part began before the “stag” part. I don’t doubt that stagnation can cause some firms to raise prices, and that rising interest rates can produce some inflationary feedback, but on balance, tight money (by means, specifically, of the slowdowns it induces) seems to have been a very effective way of reducing the inflation rate. If tight money weren’t the way to do it, one would have to wonder how inflation could possibly be eliminated once it appears.

There is a stronger empirical case to be made, perhaps, for the proposition that booms are not necessarily inflationary. At least there is the salient example of the late 1990s, but even in that case the inflation rate crept upward as the boom moved toward its acme. The rise in inflation rates was more dramatic (though by no means catastrophic) in the more powerful boom of the late 1960s. Generally booms have been associated with moderate but not severe inflation, except in the early (and arguably, again in the late) 1970s when OPEC took advantage of boom conditions by raising oil prices dramatically.

Robert Eisner, whom Galbraith cites as a fellow “Old Keynesian,” argued that booms are in fact not inflationary but slowdowns do have disinflationary effects. In other words, the Phillips curve – the relation between inflation (vertical) and unemployment (horizontal) – is concave, bending downward as it moves to the right. The policy implications are interesting: this view would seem to imply no disadvantage in maintaining a zero interest rate policy during normal conditions. Nonzero interest rates (which would probably end up far from zero) could be reserved for those occasions when inflation (presumably sui generis and unavoidable) needs to be throttled from the system. It’s an intriguing possibility, but one has to be a tad worried about whether the political will to tame such inflations would be forthcoming.

My reading of Keynes’ General Theory, however, suggests an interpretation that is, in some ways, just the opposite. While my Keynes would agree with Eisner’s Keynes that there is a region in which the Phillips curve is fairly flat, my Keynes would say that region is on the right, not on the left. That is, the curve is convex, bending to the right as it moves downward, instead of the other way around.

The policy implications of this view are also interesting: a stimulus policy to raise employment continues to work extremely well up to a point, but then it starts to turn more and more rapidly into an inflationary disaster. This does tend to argue for a “Don’t shoot until you see the whites of their eyes” policy toward inflation, but it also suggests that (1) you want to be cautious about approaching that point and (2) once you get there, you want to make an all-out attack. It also implies that it’s worth devoting a very large amount of resources to finding out just where that inflection point lies. The cost of being wrong in either direction is quite high in terms of either foregone employment or unnecessary inflation.


UPDATE: I should point out that the shape of the Phillips curve (concave, convex, or linear) is a separate issue from whether it has the “accelerationist” property that gives rise to the NAIRU concept. With Eisner's concave Phillips curve, there might still be a NAIRU, but the inflationary cost of going below it would be small, and it would be advantageous to keep unemployment below the NAIRU most of the time and allow a very slow rise in the inflation rate, which could then be brought down again fairly quickly when it started to reach an unacceptable range. The NAIRU idea would not have pleased “my” Keynes, but it is gospel to many contemporary proponents of the convex Phillips curve that I associate with him.

UPDATE2: Added parenthetical links at top.

Labels: , , , , , ,

How do you say NAIRU in Japanese?

Having posted an unpleasant philosophical rant (possibly offensive to conservatives, liberals, Christians, Muslims, Jews, Buddhists, and atheists all at once) as the obligatory non-NAIRU-related post, I now return to the Master of All Topics.

In a comment to a Battlepanda post (acknowledged by Angelica in a subsequent post), I argued that Japan’s experience argues strongly for the pragmatic value of the NAIRU theory:

…if Japan had paid more attention to the unemployment rate, and the fact that it was rising above its historical norm (guesstimated NAIRU), they would have made an earlier and more aggressive policy response to what eventually became deflation, and might have avoided it.


and again:

If you believe in the NAIRU theory, and you observe that unemployment is at or near a historical high, and that the inflation rate is already near zero, then there should be deflation alarms going off all over the place. You should go absolutely wild with the economic stimulus. That was the situation in Japan in 1994-1996, but I don’t think anyone could say they went wild with the stimulus.


I wasn’t sure just how strongly the data supported my contention until I looked, more recently, at the exchange rate series. As Raymond’s dad would say, holy crap! The value of the yen (against the dollar) set a new record high in the exact same month (April 1995) as the Japanese unemployment rate. Was there a shortage of printing presses at the Bank of Japan, or what?

I guess this is what led economist Rudi Dornbusch to say that Japan was shooting itself in the foot. To which Alan Abelson of Barron’s later replied (forecasting a recovery of the dollar, I think) that Japan might shoot itself in the foot, but it wouldn’t shoot itself in the head. Subsequent experience, however, seems to indicate that Japan had already completed its act of economic hari-kari. I think it’s fair to say, if Larry Meyer had been there, it wouldn’t have happened.

The difficulty, though, is that Japan’s Phillips curve has never been very well-behaved, so maybe the Japanese had reason to think that the NAIRU didn’t apply. I tried fitting a “dumb” Phillips curve (i.e., without any control variables) to the pre-1995 Japanese data. While the parameter values look reasonable (and imply that Japan was already far above its NAIRU by mid-1993), the parameters are not statistically significant. In other words, there is so much noise in the Japanese data that you can’t trust the signal. I suspect, though, that a more sophisticated analysis, including controls like, say, oil prices and exchange rates, would result in a much better fit. It’s a shot in the dark, but I wonder if anyone who reads this might know of a better analysis that might have been done (prior to the late 90s, when the Japanese unemployment rate rose well into uncharted territory).

Labels: , , , , , ,

Friday, June 09, 2006

If not NAIRU then what?

Already, I realize I’m going to have to start spacing out my NAIRU posts, or I’ll have to change the name of this blog to “NAIRU and…” But the NAIRU wars continue, and this is a good time for my first substantive post on the subject.

In my first reply to Angelica (Battlepanda) in the comments to the link above, I conclude:

But eventually, at some point, you will have to raise interest rates. How do you determine that point, and why? Whatever answer you give will imply some theory about the way the world works, and it may or may not be a better theory than the NAIRU. If we don’t know what the theory is, though, we’ll probably never know if it’s a better theory.


Here I will suggest and comment on some possible alternatives, to argue (briefly) why I think they are not sufficient to make the NAIRU theory obsolete:

1. intuition.

First of all, this is a nice trick if you can do it. If you can clone Alan Greenspan ad infinitum, we’ll probably be fine. Otherwise, I’m not so sure. Among ordinary mortals, intuition can be severely clouded, for example, when the man who appointed you is a corrupt megalomaniac who thinks the future of the free world depends on his being reelected.

Second of all, “intuition” really begs the question. “Intuition” means either that you have a theory you don’t know how to express (or can’t explain why you believe), or that you have several theories you are weighing in your mind. In Greenspan’s case it was maybe a little of both. Though Greenspan publicly disavowed the starkest version of the NAIRU theory, there was surely some version of the theory in the witch’s brew of theories that informed his intuitive decisions. And the Fed’s course in the late 90s seems pretty close to optimal (at least if you don’t think they should worry about asset bubbles). If Larry Meyer and his fellow NAIRU advocates hadn’t been there to toss in some eye of newt, the brew might not have had the right effect.

2. downward-sloping long-run Phillips curve

This is the theory that prevailed before the NAIRU unseated it. Personally, I think economists were too hasty to reject it. The inflation of the 1970s provided a strong emotional argument against the old theory, but the inflation had various other contributing causes (e.g., OPEC, a tumultuous labor market, a corrupt megalomaniac working with an intuitive Fed chairman) besides a possibly bad theory that might have distorted policy. But good luck trying to convince just about any other living economist today to resurrect the old Phillips curve! It’s like trying to sell whiskey to a Salvation Army general.

3. privatized monetary policy

The Austrian school argues (IIRC) that we should get rid of the Fed altogether and let banks create their own money, secured by the credibility of their promise to pay in gold (or in something else of value). This is a really bad idea. Don’t even get me started.

4. monetary aggregate targeting

Been there. Done that. The results weren’t pretty. And that was before the last 20 years of financial innovations, which have further softened the links between nominal income and the money supply. Like the downward-sloping long-run Phillips curve, this is an idea that has been tried and rejected, but in this case I agree with the consensus. (By the way, anyone who is familiar with the career of Milton Friedman will see a certain irony in proposing monetary aggregate targeting as an alternative to the NAIRU theory.)

5. real business cycle theory

I doubt that anyone who reads this blog will seriously suggest using this as a primary guide to policy, but I include it because it’s still the most academically respectable alternative to the NAIRU. If anyone does think this is the way to go, I’d be interested to hear details.

6. commodity targeting

This is what supply-siders tend to like, but I notice they tend to change their minds about which commodities to target depending on what policy implications suit their current fancy. I think it’s a very bad idea anyhow. Over the last few years, for example, various commodity prices have been rising rapidly. If our currency were tied to those commodities, we would be contracting the money supply and deflating the rest of the economy. Of course, we could have chosen commodities that don’t happen to be rising now, but then some other day we’ll have the same problem. (And if we’re allowed repeatedly to change which commodities to target, then this is no policy at all.)

7. Taylor rule without an output term

In other words, raise interest rates when the inflation rate goes up, and get more aggressive the more it goes up. I guess this is the most obvious, and the most widely acceptable, alternative.

But it’s a dumb idea. Implicitly, it’s based on a theory that is even dumber than the NAIRU theory: namely, that next year’s inflation rate equals this year’s inflation rate (plus some completely unpredictable random change). The implication is that economists who forecast inflation have been complete failures and should be replaced by someone who just copies a number from one spreadsheet cell to another. That’s just not true: while they haven’t done nearly as well as one might hope, they haven’t completely failed.

There is plenty of information (the unemployment rate being the most obvious example) that can help forecast inflation, and the Fed should take advantage of that information. For Heaven’s sake, if the unemployment rate goes down to 3%, I don’t care if you see any new inflation yet; you’ve gotta raise interest rates! And if it goes up to 9%, I don’t care if you don’t see the inflation rate falling yet; you’ve gotta cut interest rates!

8. any other ideas?

I have some that I like, but that’s for another post. (And I’m really talking about ideas derived from the NAIRU theory, anyhow.)


UPDATE: OK, I was a little unfair to the Taylor rule (7). Obviously there has to be some feedback from monetary policy to inflation; otherwise nothing the Fed did would have any effect. So the implied theory is not quite as degenerate as I suggested. However, it is essentially saying that the process by which monetary policy affects the inflation rate is a “black box,” the contents of which we know nothing about. That’s just silly.

Labels: , , , , ,

Wednesday, June 07, 2006

My NAIRU, Right or Wrong… (Prelude)

I think that Keynesian economics can do better than the NAIRU theory, but I also think that, in order to move forward, we need to be able to explain the value of the existing theory. Although I’ve maligned it in the past, today my duty as a Keynesian calls me to defend the NAIRU. Well, maybe I’m not the best soldier, but…how do you load this damn thing, anyway? (We have a lot of friendly fire casualties; it may not always be clear which side I’m on.)

So far we have only a couple of minor battles:

The first battle

The second battle
(Read and then click on "Comments")

Also, an earlier skirmish – with a different, better trained but less focused, rebel contingent, previously observed preparing for battle

Labels: , , , , ,

Tuesday, April 18, 2006

About About

Apparently About.com is not a reliable source. You can check this link to see if they have corrected the error, but the following is exactly what I cut and pasted from the linked page:

“The unemployment statistics and national unemployment rate do not include workers whose unemployment compensation benefits have expired or those who have given up looking for a job.”

...and later on:

“The unemployment statistics don't including people no longer collecting unemployment benefits or those who have given up looking for work.”

Everyone who has studied labor economics or Bureau of Labor Statistics methodology knows that the part about unemployment benefits is wrong. The unemployment rate does not depend on who is getting benefits. The unemployment rate comes from the Current Population Survey, and workers whose unemployment compensation benefits have expired are still counted as long as they meet the BLS definition of “unemployed”: “Persons are classified as unemployed if they do not have a job, have actively looked for work in the prior 4 weeks, and are currently available for work.” (You can dig deeper on the Web site to find a more precise definition and description of the methodology, but this is the gist of it.)

It’s important that many people have given up looking for jobs, so they are not counted as unemployed (and also not receiving benefits). Also, many whose benefits have expired have taken part-time jobs and therefore are also not counted as unemployed. And many people are still looking for jobs but not “actively”, and those people are also not counted. And many may be looking actively but have made other commitments that prevent them from starting immediately, and those also are not counted. But it has nothing directly to do with whether you receive unemployment benefits.

Labels: , , , , ,