More about Compensation and Productivity
In my previous post I discussed the empirical relationship between compensation growth and productivity growth in the US. One way of looking at the relationship is to look at the changes in labor’s share of total product – that is, gross compensation divided by gross output. This chart shows the evolution of labor’s share, measured 3 different ways (all computed for the business sector and expressed relative to their 1948 levels). The purple line (continued with estimates in yellow) uses NIPA data and divides “compensation of employees” by “gross value added.” The dark blue line (corresponding roughly to Lazear’s results) uses BLS data and divides “compensation” by “current dollar output.” The light blue line (corresponding roughly to Calculated Risk’s results) uses BLS data and divides “real hourly compensation” by “output per hour.”
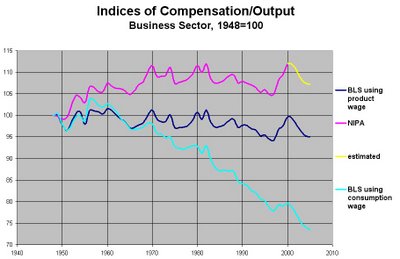
The NIPA (purple) results are probably misleading because they ignore the decreasing role of proprietors’ income in the national accounts: labor’s share increased during the 50s and 60s because more production was shifted to the corporate sector in which labor gets separate compensation.
The BLS “product wage” (dark blue) results show a relatively steady share, although one might argue that there is a slight downward trend over time. In terms of dollars, workers are getting an output share only slightly smaller than what they got in 1948.
The BLS “consumption wage” (light blue) results show a dramatically declining share for labor. In terms of what they can buy with the money (compared to what firms can buy with their share), workers are getting a much smaller share (down by a factor of .73) than they were in 1948.
This discrepancy points to a basic flaw in the broadly phrased argument that “if productivity is rising rapidly, then standards of living for workers will also rise rapidly.” For the kind of time horizons that we’re dealing with here, the premise has to be about productivity of consumer goods, not productivity in general. Since productivity of consumer goods has in fact risen (though not as rapidly as overall productivity) and is expected to continue rising, Lazear still has a case to make, but he hasn’t quite made the case yet.
Labels: data, economics, income distribution, inflation, labor, macroeconomics, wages
posted by knzn at 7/20/2006 04:47:00 PM
![]()
![]()


2 Comments:
If you compare real compensation in the nonfarm business sector to productivity growth you find that in the 1948-74 high productivity era real compensation growth averaged about 90% of productivity growth.
In the 1976-95 low productivity era this ratio fell to about 50%
and since productivity growth
rebounded in 1996 this ratio has been about 70%.
By breaking the results into these eras of different productivity one can see clear breaks in the relationship between productivity and real compensation growth.
Moreover, the compensation data includes both management and labor so it does not address the issue of much different results for different labor segments.
Interestingly the ratio of productivity growth to real gdp growth also experienced similiar shifts.
酒店喝酒,禮服店,酒店小姐,酒店領檯,便服店,鋼琴酒吧,酒店兼職,酒店兼差,酒店打工,伴唱小姐,暑假打工,酒店上班,酒店兼職,ktv酒店,酒店,酒店公關,酒店兼差,酒店上班,酒店打工,禮服酒店,禮服店,酒店小姐,酒店兼差,暑假打工,酒店經紀,台北酒店,禮服店 ,酒店小姐,酒店經紀,酒店兼差,寒假打工,酒店小姐,台北酒店,禮服店 ,酒店小姐,酒店經紀,酒店兼差,暑假打工,酒店小姐,台北酒店,禮服店 ,酒店小姐,酒店經紀,酒店兼差,寒假打工,台北酒店,禮服店 ,酒店小姐,酒店經紀,酒店兼差,暑假打工,酒店小姐,台北酒店,禮服店 ,酒店小姐,酒店兼差,暑假打工,酒店小姐,台北酒店,禮服店 ,酒店小姐,酒店經紀,酒店兼差,寒假打工,酒店小姐,台北酒店,禮服店 ,酒店小姐,酒店經紀,酒店兼差,暑假打工,酒店小姐,台北酒店,禮服店 ,酒店小姐,酒店經紀,酒店兼差,寒假打工,酒店小姐,台北酒店,禮服店 ,酒店小姐,酒店經紀,酒店兼差,暑假打工,酒店小姐,禮服店 ,酒店小姐,酒店經紀,酒店兼差,寒假打工,酒店小姐,禮服店 ,酒店小姐,酒店經紀,酒店兼差,暑假打工,酒店小姐,禮服店 ,酒店小姐,酒店經紀,酒店兼差,寒假打工,酒店小姐,禮服店 ,酒店小姐,酒店經紀,酒店兼差,暑假打工,酒店小姐,酒店傳播,酒店經紀人,酒店,酒店,酒店,酒店 ,禮服店 , 酒店小姐,酒店經紀,酒店兼差,暑假打工,招待所,酒店小姐,酒店兼差,寒假打工,酒店上班,暑假打工,酒店公關,酒店兼職,禮服店 , 酒店小姐 ,酒店經紀 ,酒店兼差,暑假打工,酒店,酒店,酒店經紀,酒店領檯 ,禮服店 ,酒店小姐 ,酒店經紀 ,酒店兼差,暑假打工, 酒店上班,禮服店 ,酒店小姐 ,酒店經紀 ,酒店兼差,暑假打工, 酒店上班,禮服店 ,酒店小姐 ,酒店經紀 ,酒店兼差,暑假打工, 酒店上班,酒店經紀,酒店經紀,酒店經紀
Post a Comment
<< Home